Check Trend in Abundance and Taxonomic Assignment
Source:R/trendAbundanceAssignment.R
trendAbundanceAssignment.RdCheck Trend in Abundance and Taxonomic Assignment
trendAbundanceAssignment(x, quantiles = seq(0, 95, by = 10), plot = TRUE)Arguments
- x
A phyloseq object
- quantiles
Abundances values to sort. Can be changed to specify how many values in a distribution are above or below a certain limit.
- plot
Logical. Default is TRUE.
Value
Either a list with data.frame and plot or just ggplot object.
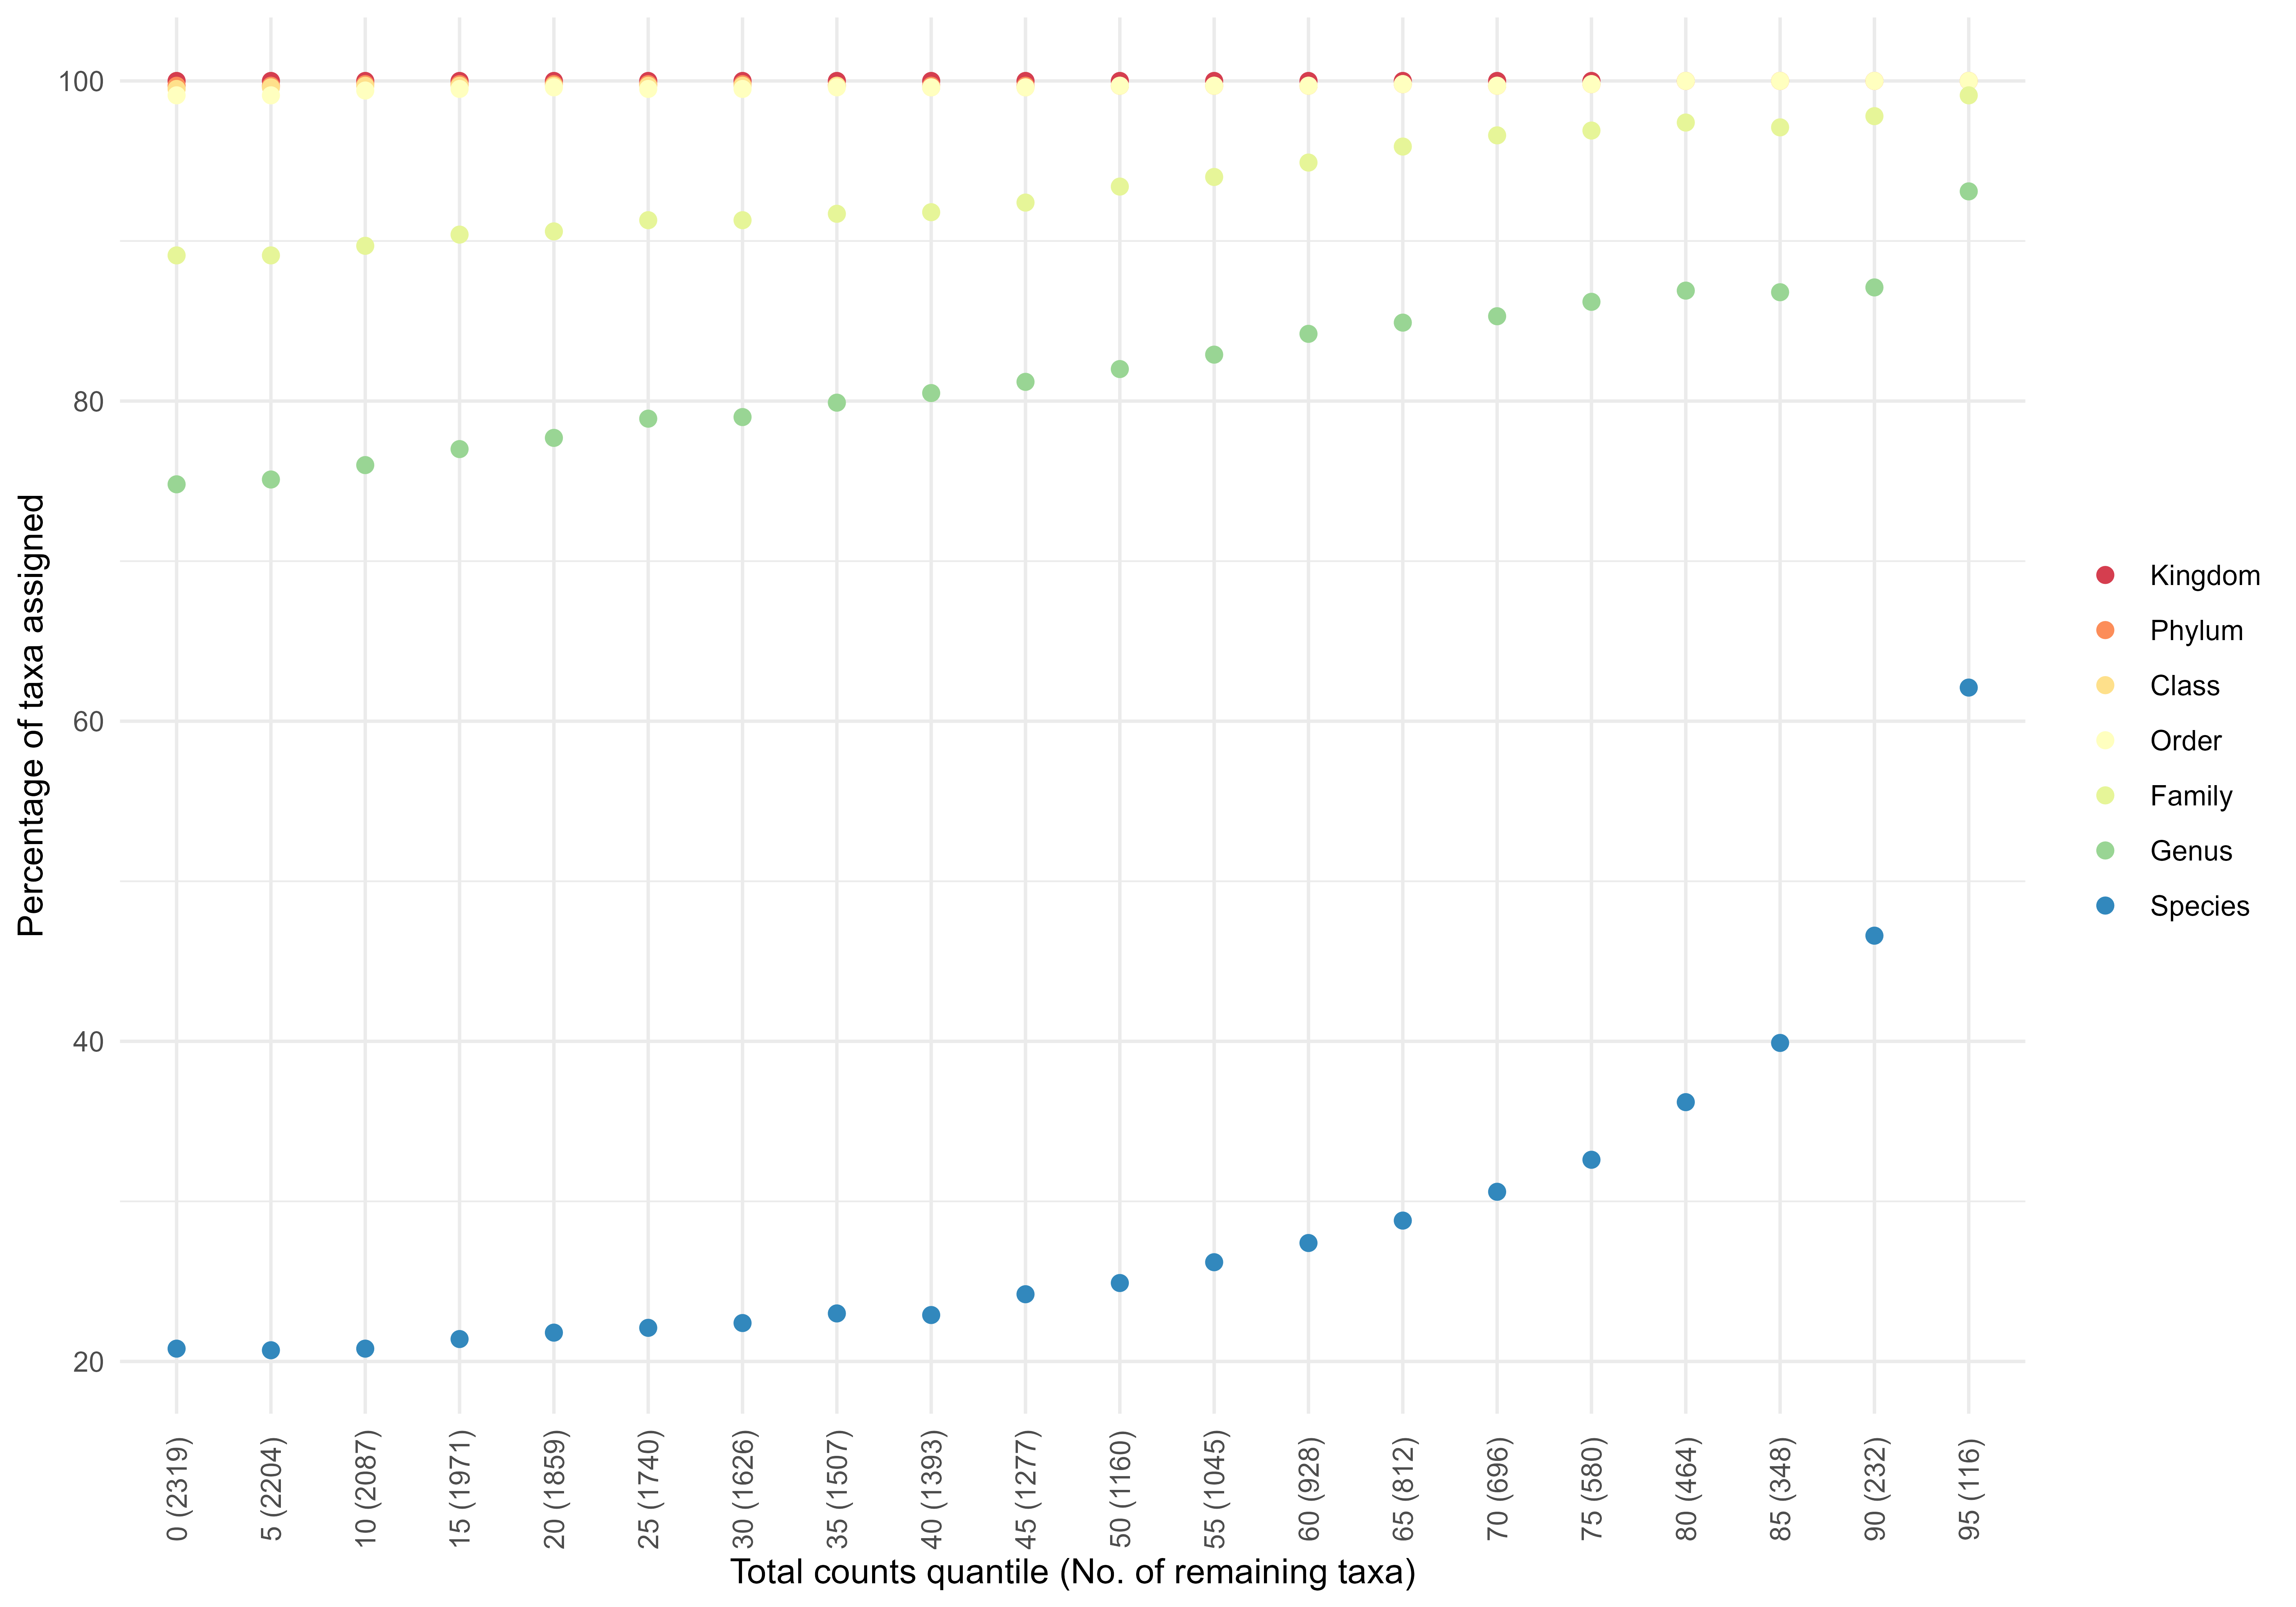
Details
Check if the more abundance-prevalent taxa have better taxonomic assignments. This is a pre-check, not corrected for differences in sequencing depth.
References
Thorsten Brach, 2018. MicrobiomeX2 Pipeline. GitHub. https://github.com/TBrach/MicrobiomeX2 https://github.com/TBrach/Dada_Pipel/blob/master/Generalized_Phyloseq_Analysis_New.Rmd
Examples
library(biomeUtils)
data("SprockettTHData")

p1 <- trendAbundanceAssignment(SprockettTHData,
                              quantiles = seq(0, 95, by = 5),
                              plot=TRUE)
p1 + ggplot2::scale_colour_brewer("", palette = "Spectral") +
    ggplot2::theme_minimal() +
    ggplot2::theme(axis.text.x = element_text(angle=90, vjust=0.5))