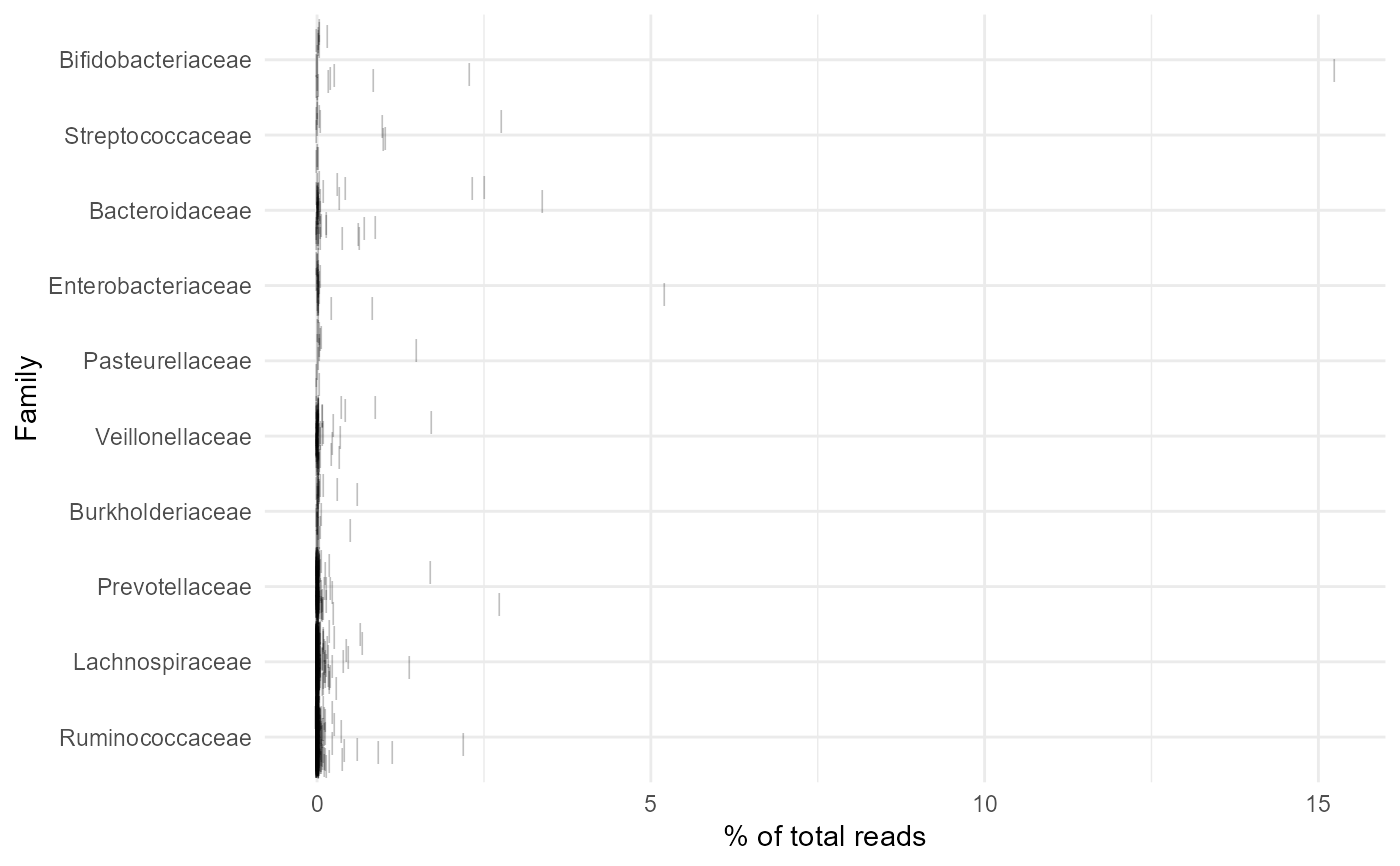
Plot Top Abundant Taxa
plotTopAbundant.RdPlot Top Abundant Taxa
plotTopAbundant(x, taxa_level = "Family", top = 10L, ...)Arguments
- x
phyloseqobject- taxa_level
Taxonomic level at which features are selected. Abundances are summed up for each of the taxa at this level and then top are selected.
- top
Numeric value, how many top
taxa_levelto return. Default top = 100- ...
Options to pass ggplot2::geom_jitter()
Value
A ggplot2 object.
Details
Plot the features with the highest abundance in all samples, at a user specific taxonomic level.
References
Shetty SA (2021). Data visualization for microbiome analytics. https://github.com/microsud/biomeUtils