Creates a Heatmap using `TidyHeatmap` and `ComplexHeatmap`
plotTidyHeatmap.RdCreates a Heatmap using `TidyHeatmap` and `ComplexHeatmap`
plotTidyHeatmap(
  x,
  select_taxa = NULL,
  group_samples_by = NULL,
  add_taxa_label = TRUE,
  ...
)
Arguments
- x
phyloseq-classobject.- select_taxa
Features to plot.
- group_samples_by
A column in
sample_datato group tiles.- add_taxa_label
Logical. Default is TRUE.
- ...
Arguments forwarded to tidyHeatmap::heatmap and ComplexHeatmap::Heatmap.
Value
a heatmap object.
Details
A TidyHeatmap plotting wrapper for phyloseq-class object.
References
Shetty SA (2021). Data visualization for microbiome analytics. https://github.com/microsud/biomeViz
Examples
library(biomeUtils)
library(biomeViz)
library(microbiome)
library(dplyr)
ps <- FuentesIliGutData %>%
microbiome::transform("compositional")
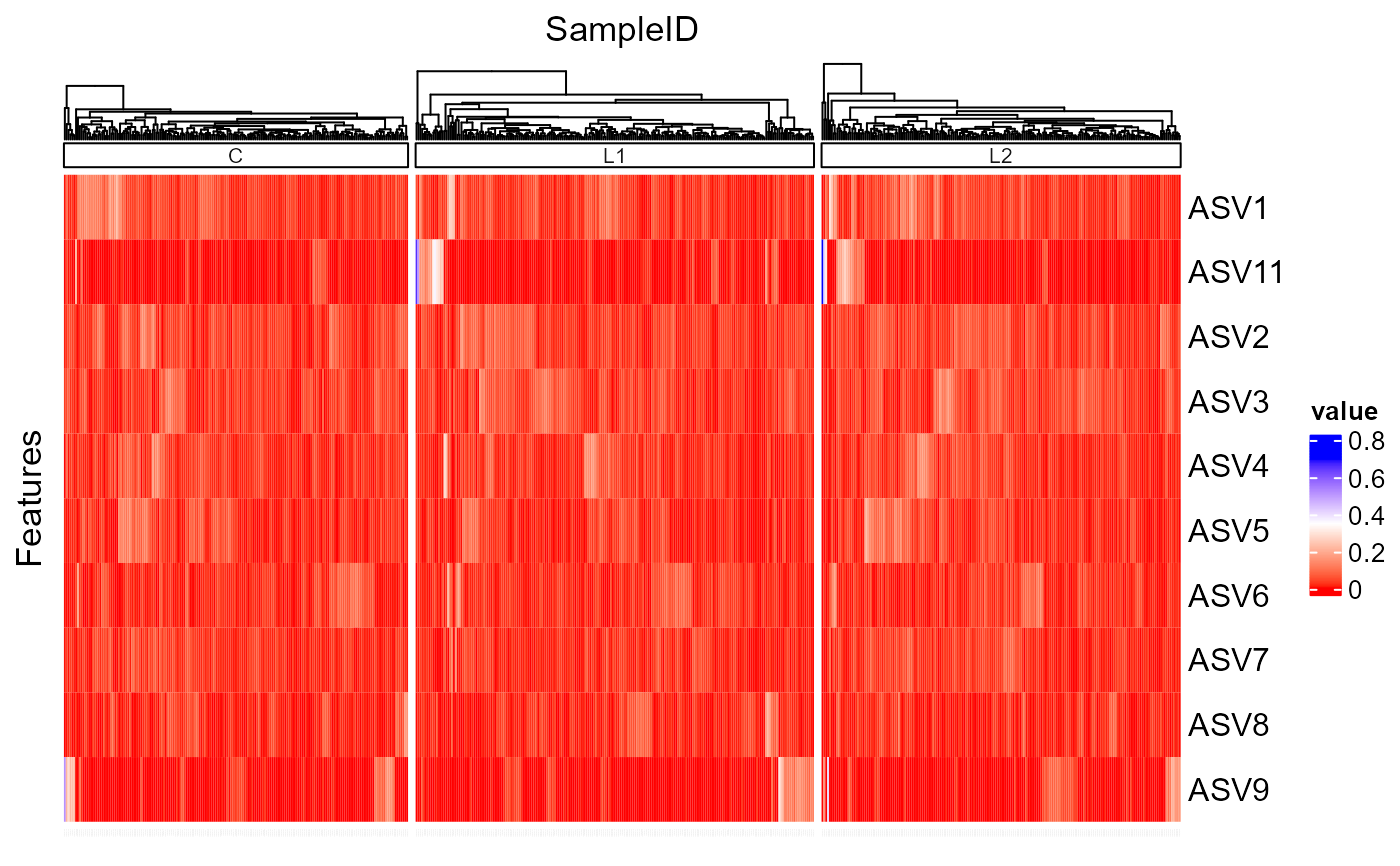
select_taxa <- findTopTaxa(ps, top= 10, method="mean")
plotTidyHeatmap(ps, select_taxa = select_taxa,
group_samples_by = "ILI",
add_taxa_label = FALSE,
cluster_rows = FALSE,
.scale = "none",
transform = NULL,
palette_value = c("red", "white", "blue"))
#> Registered S3 method overwritten by 'dendextend':
#> method from
#> rev.hclust vegan
#> tidyHeatmap says: (once per session) from release 1.7.0 the scaling is set to "none" by default. Please use scale = "row", "column" or "both" to apply scaling
#> Warning: The `.scale` argument of `heatmap()` is deprecated as of tidyHeatmap 1.7.0.
#> Please use scale (without dot prefix) instead: heatmap(scale = ...)
#> This warning is displayed once every 8 hours.
#> Call `lifecycle::last_lifecycle_warnings()` to see where this warning was generated.