Creates a Raincloud plot
plotTaxaRaincloud.RdCreates a Raincloud plot
plotTaxaRaincloud(
  x,
  taxa = NULL,
  group_samples_by = NULL,
  opacity = 0.25,
  shape_point = 21
)
Arguments
- x
phyloseq-classobject.- taxa
Feature to plot.
- group_samples_by
A column in
sample_datato compare abundances.- opacity
Alpha value.
- shape_point
Point shape.
Value
a ggplot2 object.
Details
A Rain Cloud plotting wrapper for phyloseq-class object.
References
Shetty SA (2021). Data visualization for microbiome analytics. https://github.com/microsud/biomeViz
Scherer Cédric (2021). A Step-by-Step tutorial as supplement to my talk “ggplot Wizardry: My Favorite Tricks and Secrets for Beautiful Plot in R” at OutlierConf 2021. https://z3tt.github.io/OutlierConf2021/
Examples
library(biomeUtils)
library(biomeViz)
library(microbiome)
library(dplyr)
ps <- FuentesIliGutData %>%
microbiome::aggregate_taxa("Genus") %>%
microbiome::transform("compositional")
# Select taxa and group to compare
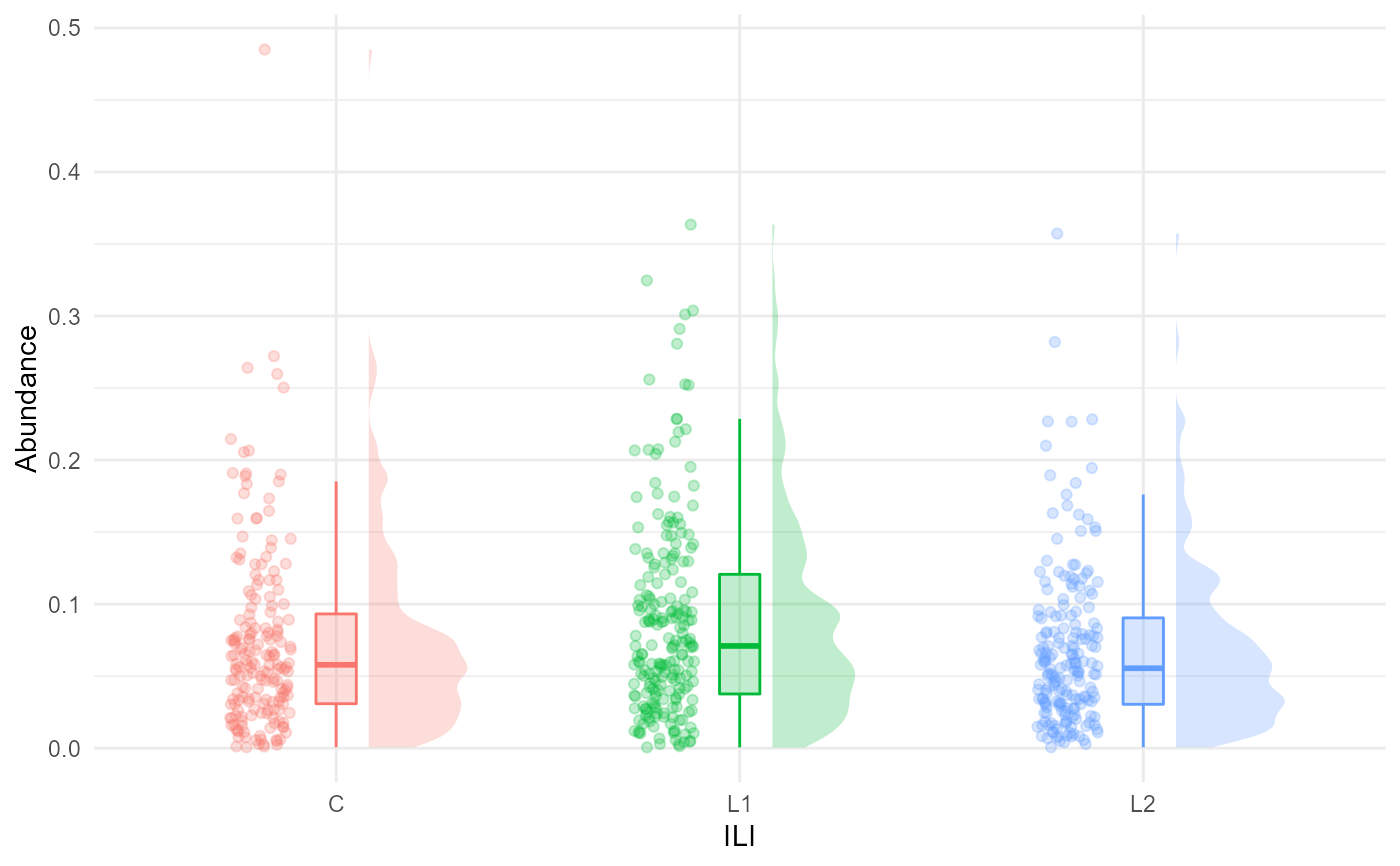
plotTaxaRaincloud(ps,
taxa ="Bacteroides",
group_samples_by = "ILI",
opacity = 0.25,
shape_point = 21)