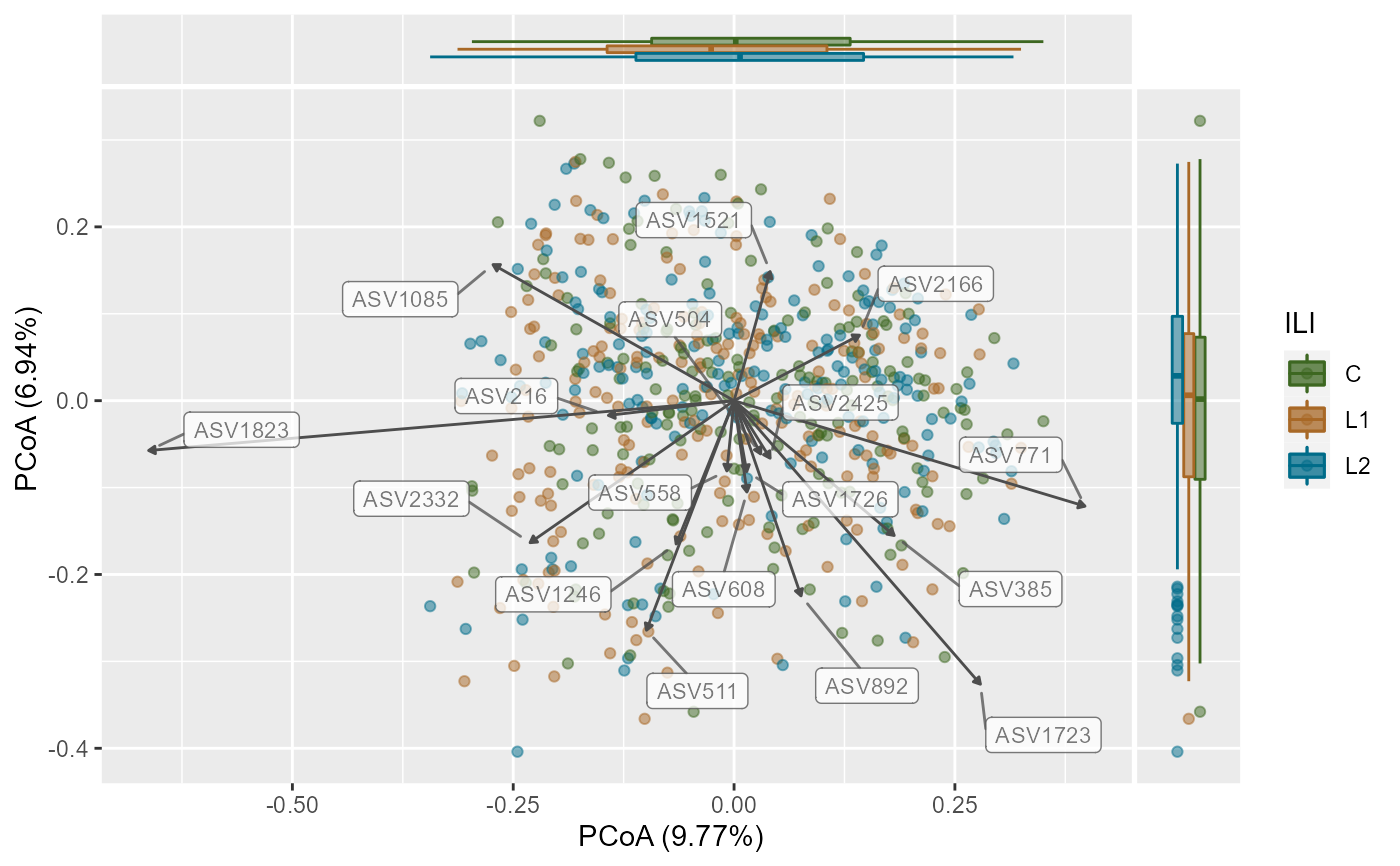
PCoA plot
plotPCoA.RdPCoA plot
Arguments
- x
phyloseq-classobject.- group_var
A column in
sample_datato compare. This is also the variable used to colour.- ord_method
Ordination method, currently tested PCoA.
- dist_method
Distance method, currently tested Bray-Curtis.
- seed
Random seed number
set.seed.- cor_method
Correlation method. Default is
Spearman.- padj_cutoff
Cut-off for multiple testing. Default is 0.05.
- padj_method
Method for multiple testing. Default is fdr.
- arrows
Logical. If arrows for taxa with correlation to axis are to be plotted. Default is TRUE.
- label_col
Color of labels. Default is grey30.
- plot_centroids
Logical. To plot centroids or not. Default is TRUE.
- add_side_box
Logical. To plot side boxplots or not. Default is TRUE.
- axis_plot
Which axis to plot. Default is first two.
- point_shape
Shape of the points. Default is 21.
- point_alpha
Opacity of points. Default is 0.5
- verbose
Logical. Messages to print. Default is TRUE.
- ...
Additional arguments to pass to vegan's adonis function.
Value
a ggplot2 object.
Details
A Principal Coordinates Analysis for phyloseq-class object.
To visualize similarities or dissimilarities between samples in 2D ordination.
This function extends the phyloseq ordination plots to include
taxa that correlate with choosen axis and plots them along with a
side boxplot for comparing inter-sample variation within groups.
References
Shetty SA (2021). Data visualization for microbiome analytics. https://github.com/microsud/biomeViz
Examples
library(biomeUtils)
library(dplyr)
library(ggside)
#> Registered S3 method overwritten by 'ggside':
#>   method from
#>   +.gg   ggplot2
ps <- FuentesIliGutData %>%
  microbiome::transform("compositional") %>%
  mutateTaxaTable(FeatureID = taxa_names(FuentesIliGutData))
plotPCoA(x =ps,
         group_var = "ILI",
         ord_method = "PCoA",
         dist_method = "bray",
         seed = 1253,
         cor_method = "spearman",
         verbose = TRUE,
         padj_cutoff = 0.05,
         padj_method = "fdr",
         arrows = TRUE,
         label_col = "grey30",
         plot_centroids = TRUE,
         add_side_box = TRUE,
         axis_plot = c(1:2),
         point_shape = 21,  # point_shape
         point_alpha = 0.5) +
  scale_color_manual(values = c("#3d6721", "#a86826", "#006c89")) +
  scale_fill_manual(values = c("#3d6721", "#a86826", "#006c89"))
#> Random number for permutation analysis ...
#> 1253
#> 'adonis' will be deprecated: use 'adonis2' instead
#> Warning: Second of the choosen axis in `axis_plot` has no taxa satisfying criteria to plot