Visualize one categorical column and one numeric column
plotByGroup.RdVisualize one categorical column and one numeric column
plotByGroup(x, x.factor = NULL, y.numeric = NULL)Arguments
- x
phyloseq-classobject.- x.factor
A column in
sample_datato compare that is a factor- y.numeric
A column in
sample_datato compare that is a numeric
Value
a ggplot object.
Details
A simple plotting utility for visualization of one categorical
and numerical variable. Provided a categorical variable and numerical
variable present in sample_data of a
phyloseq-class object, a comparative visualization
can be done.
References
Shetty SA (2021). Data visualization for microbiome analytics. https://github.com/microsud/biomeViz
Examples
library(biomeUtils)
library(biomeViz)
library(dplyr)
#>
#> Attaching package: 'dplyr'
#> The following objects are masked from 'package:stats':
#>
#> filter, lag
#> The following objects are masked from 'package:base':
#>
#> intersect, setdiff, setequal, union
library(microbiome)
library(ggplot2)
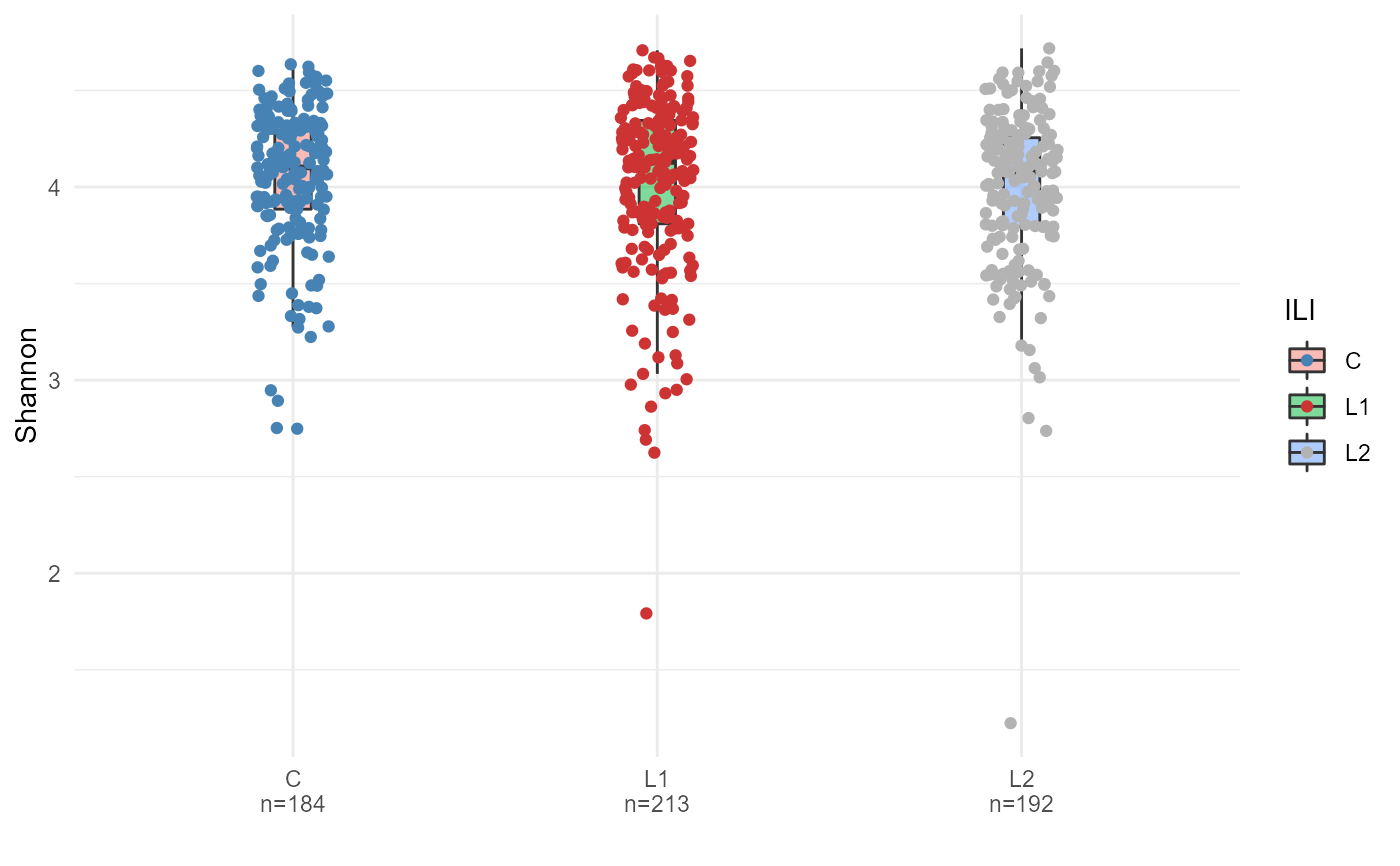
ps <- FuentesIliGutData
# calculate Shannon diversity using microbiome::diversity and add it to
# the sample_data in phyloseq using biomeUtils::mutateSampleData()
ps <- mutateSampleData(ps,
Shannon = microbiome::diversity(ps, "shannon")[,1])
plotByGroup(ps,
x.factor="ILI",
y.numeric = "Shannon") +
geom_point(aes(color=ILI),
position = position_jitter(width = 0.1)) +
scale_color_manual(values=c("steelblue", "brown3", "grey70"))